Posts

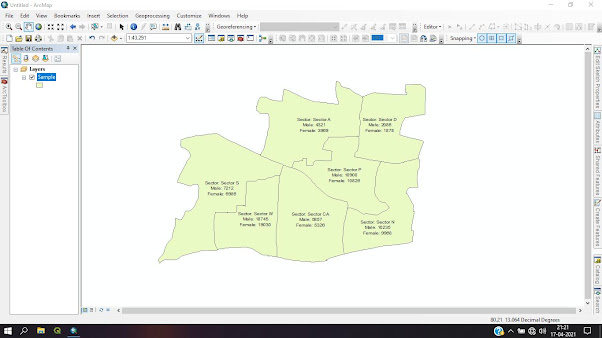
Perform Label Expression in ArcGIS (VBScript)
Image
1. Lower Case & Upper Case Lower Case:   LCase ([Field]) Upper Case: UCase ([Field])   2. Space & Comma [Field] & "   " & [Field]   &   [Field] & " , " & [Field]   3. Add New Line [Field] & vbnewline & [Field]   4. Multiplication or Addition or Subtraction [Field] * 10 or [Field] + 10 or [Field] – 10   5. Font Style Bold: "<BOL>" + [Field] + "</BOL>" Italic: "<ITA>"+ [Field] + "</ITA>" Underline: "<UND>"+ [Field] + "</UND>"   6. Name " Name: " & [Name]   7. Colour & Font "<CLR red='255'><FNT size = '14'>" + [Zone_Name] + "</FNT></CLR>"   Video:      
Image
Slope Analysis 1. Get DEM or Elevation Data: Earth Explorer (USGS) and Bhuvan (NRSC) 2.  Add  DEM or Elevation Data to Data Frame 3.  Open Arc Toolbox  in ArcMap 4.  Open -- > Spatial Analyst Tool > Surface > Slope 5.  Slope Tool 6. a.  Input Raster -- > DEM or Elevation Data,       b. Output Location -- > Saving Output Result      c.  Z Factor -- > 1 7. Result Map 8. Double Click ON > Result Map GO TO > Properties > SELECT > Symbology GO TO > Categories 9. a.  Choose no. of Classes & Classify it      b. Classification Method: Equal Interval or Manual -- > Apply 10. Change Color USING -- > Color Ramp -- > Apply Save the Result File

Delineation Of Watershed using ArcGIS

Image
Step 1: Download Aster data from USGS-Earth Explorer website  Step 2: Open Arc GIS – add downloaded Aster contours file – Merge all the contour shp files into single contour file – Click Geoprocessing tool – use Merge option – add all contour file and save it in the desired place – click ok. Step 3: Set projection to the contour file: Open Arc toolbox – Data management tool – Projections and transformations – Project – Give the input file of contour – set output coordinate system as Projection coordinate system – and click ok. Step 4: Open Arc toolbox – Spatial Analyst Tool – Interpolation tool– Topo to raster – add projection contour file - change field as elevation and set output cell size as 200 and click ok. This Video Provides the visual aid for Delineating Watershed:  https://youtu.be/pa7z0g07iZQ Step 5: Export the resulted data and save in the desired place with the desired name and add that data. Open Arc toolbox – Spatial Analyst tool

Delineation of Watershed using SRTM Data

Image
·     Step 1:    Download SRTM data from Open DEM website – Download SRTM contours as Shapefile. ·     Step 2:  Open Arc GIS – add downloaded SRTM contours file – Merge all the contour shp files into single contour file – Click Geoprocessing tool – use Merge option – add all contour file and save it in the desired place – click ok. ·     Step 3:  Set projection to the contour file: Open Arc toolbox – Data management tool – Projections and transformations – Project – Give the input file of contour – set output coordinate system as projected coordinate system – UTM  and click ok.        Step 4:  Open Arc toolbox – Spatial Analyst Tool – Interpolation tool– Topo to raster – add projection contour file - change field as elevation and set output cell size as 200 and click ok.             Step 5:  Export the resulted data and save in the desired place with the desired name and add that data.    Step 6:  Open Arc toolbox – Spatial Analyst tool – Hydrolog

Land Viewer: Download Latest Satellite Imagery and Analysis Spectral Indices on any Browser

Image
Recently, a team of Data Scientist, Software Developers and Geo-Scientist from California-established company Earth Observing System (EOS) had launched innovative cloud based tools for exiting Remote Sensing and GIS users, students, researchers and more user-friendly for the people new to GIS and Remote Sensing.    Land Viewer tool is the real–time image processing and analytics like: Access to Latest Imagery from Sentinel-2 to Oldest Imagery of Landsat MSS and TM. Easy to find the required geospatial imagery of any scale by selecting the Area of Interest on the map. Using land viewer on-the-fly imagery analytics abilities and download required image for various analysis. Using the Earth Observing System algorithms, users can compare two satellite imagery for finding the difference and selecting needed imagery for the analysis. For Example, Sentinel-2 and Landsat-8 imagery using option called “Comparison Slider” which is real-time level faster. The too